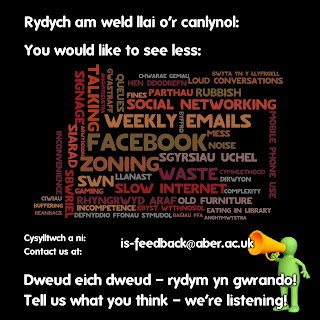
One thing that occupies an awful lot of time here is creating surveys, collating results, using those results to inform decision making and giving feedback to our customers on those results. A colleague of mine came up with a really great idea for providing a quick, visual feedback method. Customers were asked what they would like to see less of, and what they would like to see more of, and this is how she displayed the results:
Interesting to see the overlap between the two - zoning is the issue that really divides people!
We're also able to combine the Welsh and English feedback in one document, and hopefully portray some of the complexities of trying to provide a service to people with very diverse needs and expectations.


I like these bilingual word clouds of feedback Nia.
ReplyDeleteBrilliant display! Thanks for sharing it. Great idea.
ReplyDeleteVERY interesting, thank you!
ReplyDeletehttp://www.surveytool.com/making-surveys/